Creating a 2D Terrain Generator with p5.js
You can look at the source code and play with the generator here. The story of creating it goes like this -
Part 1 — Perlin Noise
The idea for the mini-project emerged after I watched part of a great Youtube series about Perlin Noise. I’ll explain here the basics you need to know for this paper, but I really recommend you watch the series to get a better understanding of Perlin Noise.
Perlin Noise [I’ll call it noise from now on] can be used to create random smooth surfaces.
How? Let’s imagine a grid. The x-axis represents time while the y-axis represents a value between 0 and 1. Every millisecond a new semi-random value is generated, while the new value is close to the previous one. This is different from true randomness in which there is no connection between adjacent values. A noise grid looks like this:
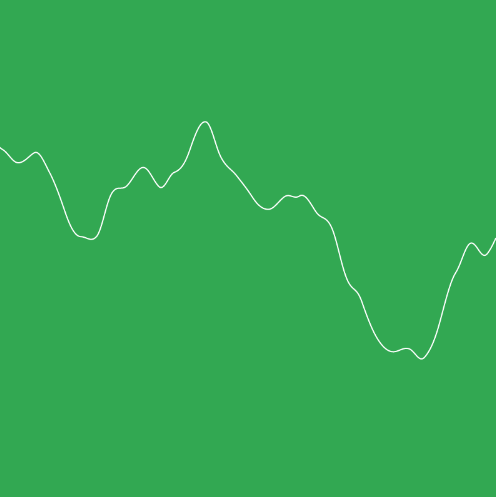
One dimensional Perlin Noise over time
Noise values can be generated for every amount of dimensions, but we need only two.
We generated a 2D noise surface and used these values to color the terrain. p5.js has a noise function that receives coordinates and returns the Perlin Noise value for that location on an imaginary noise grid created by p5.js. The same coordinates will return the same value until you reload the p5.js canvas. The farther away the coordinates are, so are the values. The code looks somewhat like this:
function setup() {
  createCanvas(550, 550);
  pixelDensity(1);
}

function draw() {
  loadPixels() ;
  for (var x = 0; x < width; x++) {
    var yoff = 0;
    for (var y = 0; y < height; y++) {
      var index = (x + (y * width)) * 4;
      var pxHeight = calculateHeight(xoff, yoff);
      pxHeight = normalize(pxHeight, x, y);
      colorPixel(index, pxHeight);
      yoff += density;
    }
    xoff += density;
  }
  updatePixels();
}

function calculateHeight(xoff, yoff) {
  var doubleAmplitude = 7000, amlitudeReductionRatio = 0.1;
  return (noise(xoff, yoff) * doubleAmplitude) - (doubleAmplitude * amlitudeReductionRatio);
}

function colorPixel(index, pxHeight) {
  var r, g, b;
  if (pxHeight <= 0) {r = 38; g = 196; b = 201;}
  else if(pxHeight < 50) {r = 143; g = 237; b = 138;}
  else if(pxHeight < 100) {r = 83; g = 235; b = 75;}
  else if(pxHeight < 250) {r = 39; g = 140; b = 34;}
  else if(pxHeight < 500) {r = 11; g = 122; b = 5;}
  else if(pxHeight < 1000) {r = 179; g = 110; b = 57;}
  else if(pxHeight < 1500) {r = 158; g = 90; b = 38;}
  else if(pxHeight < 2000) {r = 120; g = 75; b = 7;}
  else {r = 222; g = 222; b = 222;}
  pixels[index+0] = r;
  pixels[index+1] = g;
  pixels[index+2] = b;
  pixels[index+3] = 255;
}
The noise calculation can be seen in the draw() function. calculateHeight() takes the noise values and changes their scale to represent meters. It also subtracts all the values, so some of them would be under zero [represents sea level]. colorPixel() is a simple if-else statement to color every pixel by the calculated height.
As soon as we ran the code we sensed that something was wrong:
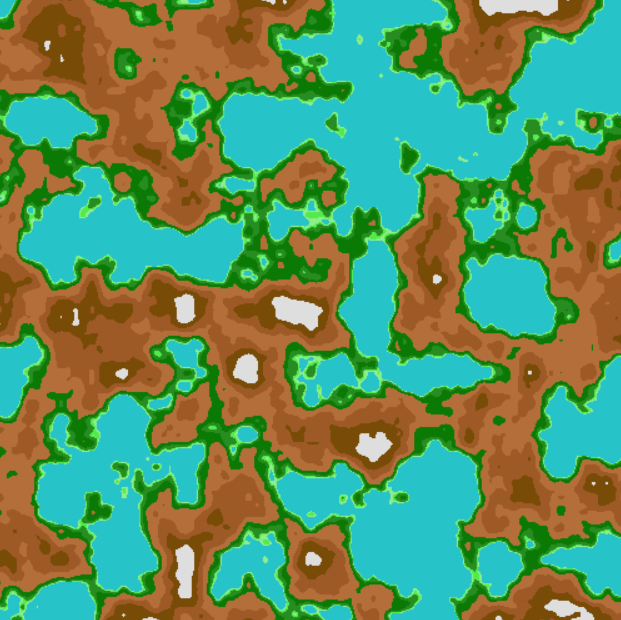
This looks like a part of a bigger map! We want a whole map, not a part of it, so we have to get rid of land on the edges of the canvas.
Part 2 — Cutting the edges
To get rid of the ground on the edges we decided to set the height of all the locations outside of the largest circle that can be drawn to zero.
var distanceFromMiddle = Math.sqrt(Math.pow(x - (width / 2), 2) + Math.pow(y - (height / 2), 2));
var newHeight = baseHeight;
if (distanceFromMiddle + 1 >= width / 2) {
  newHeight = 0;
}
The result was terrifying:
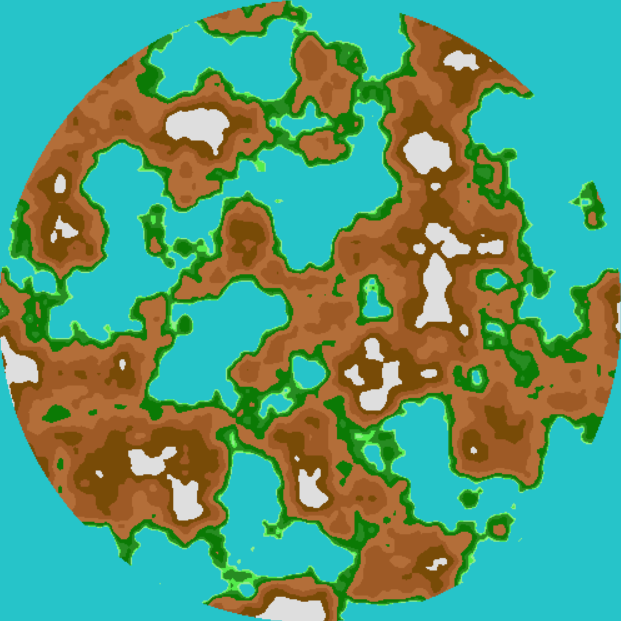
Obviously, the problem is the sudden cut. To deal with that we “normalized” the terrain by reducing the height of every location depending on its distance from the middle. We tried several methods to do so and finally settled on reducing with log:
function normalizeByLog(pxHeight , distanceFromMiddle) {
  return pxHeight \* Math.log(width / 2 - distanceFromMiddle) / Math.log(width / 2);
}
That improved the map, but still — no matter how hard we tried, the circle was too obvious:
Part 3 — The lie
The solution to this was quite simple, we lied to our own functions. We slightly increased the height sent to the normalization function, and then decreased by the same value when coloring the canvas. Here are the modified lines from the draw() function:
pxHeight = normalize(pxHeight + lie, x, y);
colorPixel(index, pxHeight - lie);
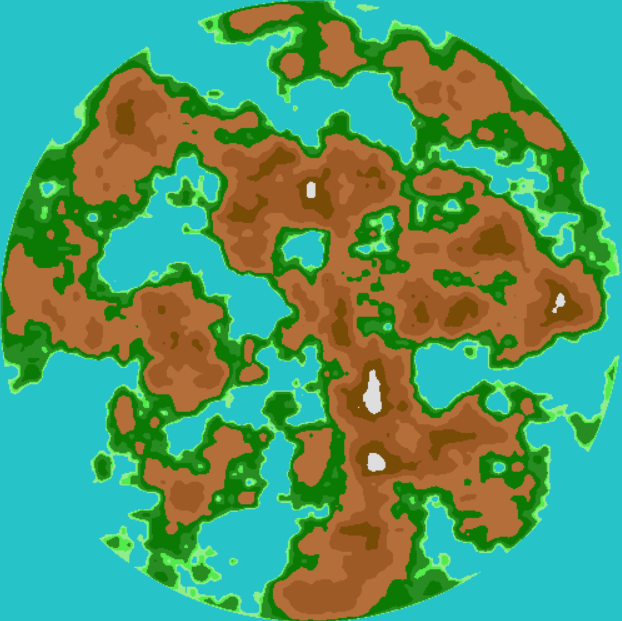
The result was… Gorgeous:
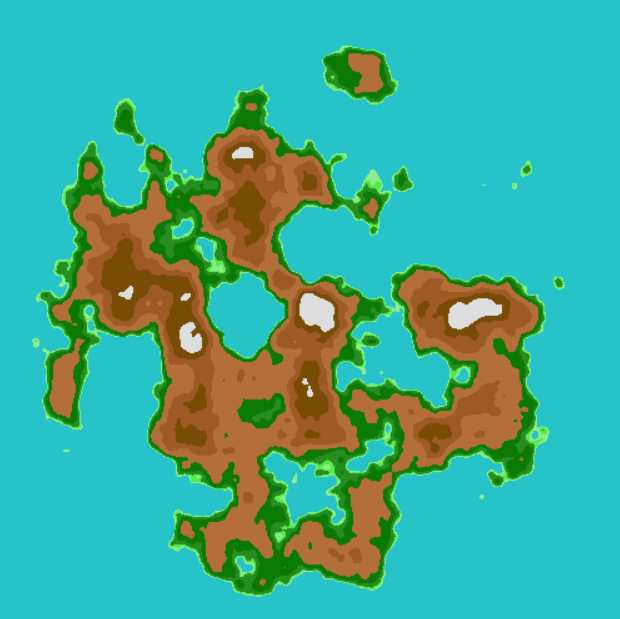
Finally!